Monitoring and Modeling Data
Our data hub offers access to a multitude of monitoring and modeling data, past and present.

This interface provides access to several types of data related to the Chesapeake Bay. Bay Program databases can be queried based on user-defined inputs such as geographic region and date range. Each query results in a downloadable tab- or comma-delimited text file that can be imported to program such as SAS, Excel and Access for further analysis. Comments regarding the interface are encouraged. Questions in reference to the data should be addressed to the contact provided on subsequent pages.
To ensure data accuracy, the Bay Program maintains a Quality Assurance Program that monitors and tracks several environmental data sets that look at pollutants, water quality, land use, algae, fish, crabs and submerged aquatic vegetation.
Data Programs
Modeling: Environmental models are essential for simulating ecosystems that are either too large or too complex to isolate for experiments in the real world. These simulations, called scenarios, allow scientists to predict positive or negative changes within our ecosystem due to management actions such as improved sewage treatment, controlling urban sprawl, or reduced fertilizer or manure application on agricultural lands.
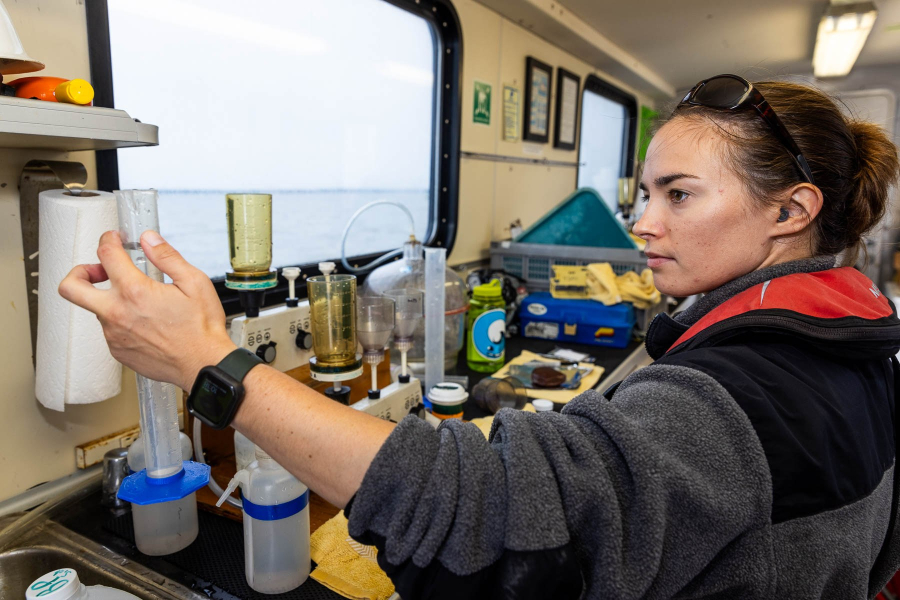
Monitoring: Monitoring the Chesapeake Bay and its tributaries allows Bay Program partners to detect changes that take place, improves our understanding of the natural environment, and reveals trends over time that can provide valuable information to policy makers. The Chesapeake Bay Monitoring Program, which began in 1984, is a Bay-wide cooperative effort involving Maryland, Pennsylvania, Virginia, the District of Columbia, several federal agencies, 10 institutions and over 30 scientists.
Resource Lands Assessment: The Resource Lands Assessment (RLA) provides a regional multi-state look at the most important remaining resource lands in the Chesapeake Bay Watershed. The RLA uses GIS models and expert knowledge to assess the value of resource lands within the watershed, providing guidance to state and local government in land protection strategy development, serving as an information resource for the land trust community, suggesting conservation focus areas to complement watershed restoration plans, and identifying areas important to maintain for the forest products industry.
Chesapeake Bay Quality Assurance Program: To insure this accuracy, the Chesapeake Bay Program maintains a Quality Assurance Program that monitors and tracks several environmental data sets that look at pollutants, water quality, land use, algae, fish, crabs and submerged aquatic vegetation. The Chesapeake Bay Quality Assurance Program ensures that information from over 40 agencies and research institutions are not only scientifically valid, but comparable among researchers working in all parts of the watershed.
Data Downloads
Water Quality
- National Estuarine Research Reserve System (NERRS)
- USGS River Input Monitoring Database (1985-2018)
Living Resources
- Baywide Benthic Database
- Baywide CBP Plankton Database
- Baywide Fluorescence Database
- Watershed Wide Benthic Invertebrate Database
- Baywide CBP Aerial SAV Survey
- Maryland Biological Stream Survey
- NOAA Fisheries Statistics and Economics Database
Point Sources
Modeling
GIS
Cross-cutting
- Atmospheric Deposition Measurement and Analysis Information Resource
- CBP Historical Data Sets
- Eyes on the Bay
- NASA LANDSAT Imagery
- National Wetlands Inventory Data
Data Tools
- Percent Light at Leaf (PLL) Calculator (Excel file): The PLL calculator is an automated Microsoft Excel 97 spreadsheet which enables you to determine the percentage of light penetrating the water column and reaching SAV leaf surface at a given depth. The model calculates PLL from four water quality variable: dissolved inorganic nitrogen (mg/l), dissolved inorganic phosphorus (mg/l), total suspended solids (mg/l), and either diffuse downwelling PAR attenuation coefficient (Kd) or Secchi depth (m). A more detailed description of the model and its use can be found in Chesapeake Bay Submerged Aquatic Vegetation Water Quality and Habitat Requirements and Restoration Targets: A Second Technical Synthesis. Get specific instructions on how to use the spreadsheet calculator. (.pdf file).
- Factors Contributing to Water Column Light Attenuation: A Diagnostic Tool (Excel file): This tool analyses Total Suspended Solids (TSS) and Chlorophyll data to determine if minimum light requirements for SAV growth are met at a given station. A more detailed description of the model and its use can be found in Chesapeake Bay Submerged Aquatic Vegetation Water Quality and Habitat Requirements and Restoration Targets: A Second Technical Synthesis. Detailed instruction on how to use this tool are located within the spreadsheet.
Data Management Programs
- Importing MS Access tables to SAS datasets
- Importing Excel files to SAS datasets
- Importing DBF files to SAS datasets
