2019-2020 Bay Barometer shows an ecosystem in mixed recovery
The Chesapeake Bay Program releases annual assessment of Bay health

The Chesapeake Bay Program’s latest assessment of Bay health shows an ecosystem in recovery from short-term weather impacts and long-term water quality degradation from excess nutrients and sediment. Released annually, the Bay Barometer: Health and Restoration in the Chesapeake Bay Watershed 2019-2020 gives an update on the progress being made toward the 10 goals and 31 outcomes of the Chesapeake Bay Watershed Agreement.
Of these 31 outcomes, 19 have indicators whose data and information are drawn from a range of trusted sources, including government agencies, academic institutions, non-governmental organizations and direct demographic and behavior surveys. The data in the Bay Barometer reflect the health of the Chesapeake Bay watershed over the course of many years, and in some cases, decades. It offers a science-based snapshot of the best available information from 2019 and 2020 on the ecological health of and our efforts to protect and restore the nation’s largest estuary.
The 2019-20 Bay Barometer offers updates for 12 out of 19 indicators:
Improvement from previous assessment period
Blue Crab Management: An estimated 17% of female blue crabs were harvested in 2019. For the 12th consecutive year, this number is below the 25.5% target and 34% overfishing threshold. The blue crab stock in the Bay is not being depleted or overfished.
Diversity: In 2019, the most recent diversity survey indicated a slight increase (13.7% to 14.6%) in the percentage of Chesapeake Bay Program partners who self-identified as people of color. The survey results also showed an increase in the percentage of people of color in Chesapeake Bay Program leadership positions from 9.1% to 10.3%.
Environmental Literacy Planning: In 2019, 27% of the local education agencies that responded to a Chesapeake Bay Program survey self-identified as “well-prepared” to deliver high-quality environmental literacy programming to their students. Of the remaining respondents, 52% identified as somewhat prepared and 22% identified as not prepared. This marks an increase in environmental literacy preparedness since the pilot Environmental Literacy Indicator Tool (eLit) survey was distributed in 2015.
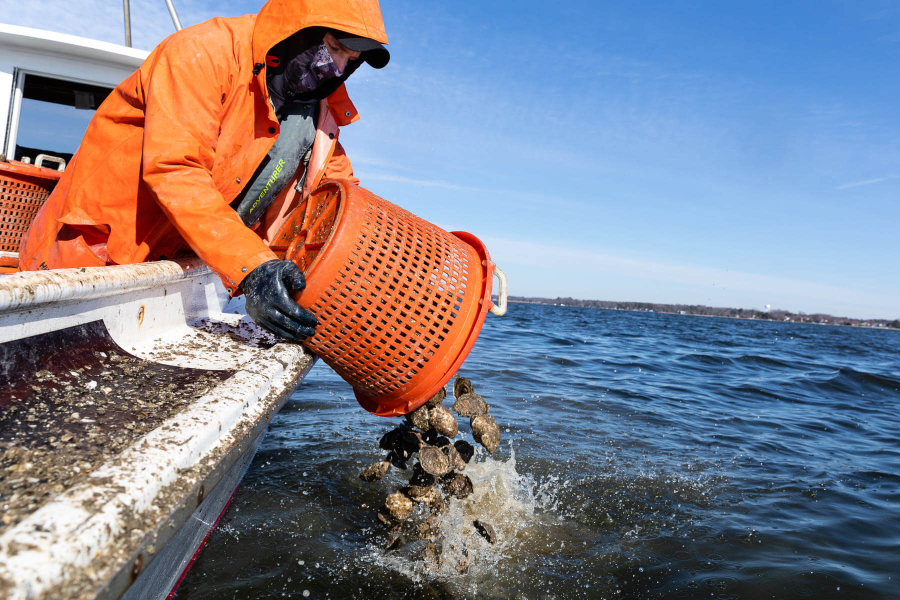
Oysters: Ten tributaries have been selected for large-scale oyster restoration and are in various stages of progress. As of 2019, Maryland has completed 788, and Virginia 539 acres of oyster reefs.
Protected Lands: Data collected between 2016 and 2018 show that nearly 1.36 million acres of land in the Chesapeake Bay watershed have been permanently protected since 2010. This marks an achievement of 68% of the outcome and brings the total amount of land protected in the watershed to 9.16 million acres.
Public Access: Between 2010 and 2019, 194 boat ramps, fishing piers and other public access sites were opened on and around the Chesapeake Bay. This marks a 65% achievement of the goal to add 300 new access sites to the watershed by 2025.
Student: In 2019, 32% of the 132 local education agencies that responded to a Chesapeake Bay Program survey reported providing Meaningful Watershed Educational Experiences (MWEEs) to at least some of their elementary school students. At the middle school level, this number rose to 38% and at the high school level, it rose to 43%. Data collected through the eLit in 2019 for elementary and middle school grades show the proportion of districts with system wide MWEEs has not increased, and that there has been only a slight increase in the high school level. However, the 2019 survey includes districts who had previously not responded, and the data suggests that these new districts are not as far along in their programming. When comparing the districts that responded in both 2017 and 2019, the number of districts with system wide MWEEs increased from 45% to 52% in elementary school, 51% to 55% in middle school and 33% to 48% in high school—indicating substantial improvement.
Decrease from previous assessment period
2025 Watershed Implementation Plans: As of 2019, conservation practices to reduce pollution are in place to achieve 39% of nitrogen reductions, 49% of phosphorus reductions and 100% of sediment reductions needed to attain applicable water quality standards when compared to the 2009 baseline established in the Chesapeake Bay Total Maximum Daily Load.
Blue Crab Abundance: Between 2019 and 2020, the abundance of adult (age 1+) female blue crabs in the Chesapeake Bay decreased 26% from 191 million to 141 million. Despite the decrease, this number remains above the 70 million threshold which is considered a sustainable level for female blue crabs in the Bay.
Forest Buffers: Between 2018 and 2019, 83 miles of buffers were planted, falling short of the annual target by 817 miles. Overall, 9,190 miles of buffers have been planted across the watershed since 2010.
Underwater Grasses: In 2019, 66,684 acres of underwater grasses were mapped in the Bay; achieving 52% of the target of 185,000 acres. This is a 38% decrease from 2018 when it was estimated that the Bay may have supported up to 108,078 acres of underwater grasses.
Water Quality Standards Monitoring and Attainment: Thirty-eight percent of the Bay and its tidal tributaries met water quality standards during the 2016-2018 assessment period. This is a 4% decrease from the previous assessment period of 2015-2017.
Did you know that you can view the most updated indicator information as soon as it becomes available? Check out ChesapeakeProgress, the Chesapeake Bay Program’s website that tracks progress toward the goals and outcomes of the Chesapeake Bay Watershed Agreement.

Comments
There are no comments.
Thank you!
Your comment has been received. Before it can be published, the comment will be reviewed by our team to ensure it adheres with our rules of engagement.
Back to recent stories