Maps
Browse through maps depicting Bay health and restoration, including pollution trends, public access sites and more.
Delivered Yield of Total Nitrogen - Point Sources
Date created: February 13, 2008This map shows the Delivered yield (load per area) of Total Nitrogen from point sources. Delivered yield is the amount of nutrient that is generated locally for each stream reach and weighted by the amount of in-stream loss that would occur with transport from the reach to Chesapeake Bay. The cumulative loss of nutrients from generation to delivery to the Bay is dependent on the travel time and instream-loss rate of each individual reach. This map shows estimates of Total Nitrogen based on mean conditions for the late 1990's time period using the SPARROW model from USGS. SPARROW, or SPAtially Referenced Regressions On Watershed (SPARROW) attributes, uses a nonlinear regression approach to spatially relate nutrient sources and watershed characteristics to nutrient loads of streams throughout the Chesapeake Bay watershed.
View map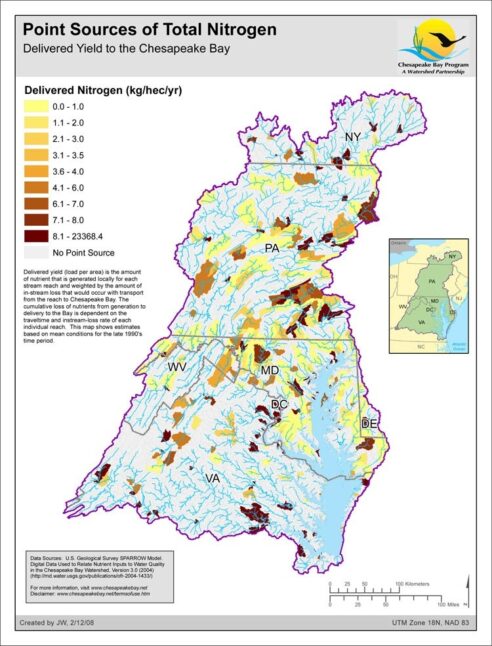
Delivered Yield of Total Nitrogen - All Sources
Date created: February 13, 2008This map shows the Delivered yield (load per area) of Total Nitrogen from all sources. Delivered yield is the amount of nutrient that is generated locally for each stream reach and weighted by the amount of in-stream loss that would occur with transport from the reach to Chesapeake Bay. The cumulative loss of nutrients from generation to delivery to the Bay is dependent on the travel time and instream-loss rate of each individual reach. This map shows estimates of Total Nitrogen based on mean conditions for the late 1990's time period using the SPARROW model from USGS. SPARROW, or SPAtially Referenced Regressions On Watershed (SPARROW) attributes, uses a nonlinear regression approach to spatially relate nutrient sources and watershed characteristics to nutrient loads of streams throughout the Chesapeake Bay watershed.
View map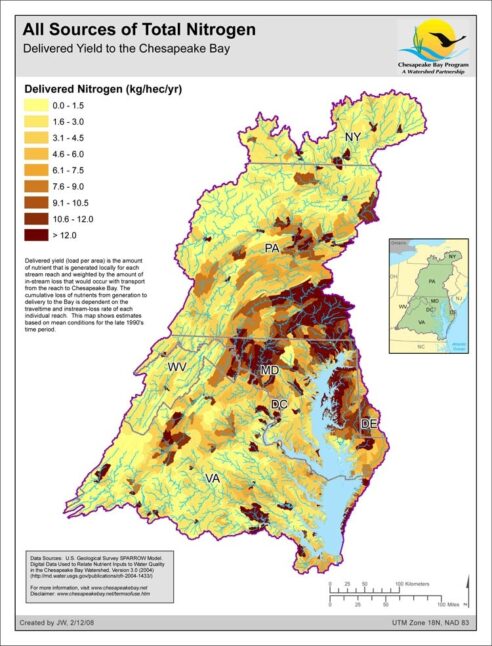
Delivered Yield of Total Nitrogen - Agricultural Sources
Date created: February 12, 2008This map shows the Delivered yield (load per area) of Total Nitrogen from agricultural sources. Delivered yield is the amount of nutrient that is generated locally for each stream reach and weighted by the amount of in-stream loss that would occur with transport from the reach to Chesapeake Bay. The cumulative loss of nutrients from generation to delivery to the Bay is dependent on the travel time and instream-loss rate of each individual reach. This map shows estimates of Total Nitrogen based on mean conditions for the late 1990's time period using the SPARROW model from USGS. SPARROW, or SPAtially Referenced Regressions On Watershed (SPARROW) attributes, uses a nonlinear regression approach to spatially relate nutrient sources and watershed characteristics to nutrient loads of streams throughout the Chesapeake Bay watershed.
View map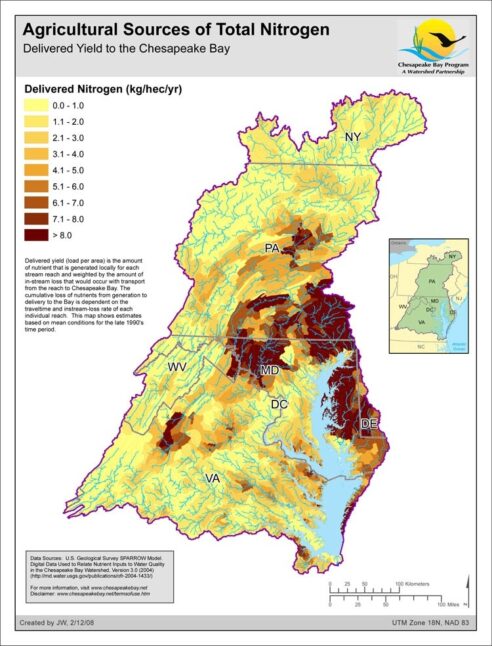
Chesapeake Bay Airshed
Date created: February 7, 2008This map depicts the Airshed that is used for Chesapeake Bay modeling purposes. The Airshed Model (Regional Acid Deposition Model - RADM) tracks nitrogen emissions from all sources in the airshed. The model is three-dimensional; it simulates movement both vertically and horizontally across a region. The Airshed Model covers the eastern United States from Texas and North Dakota eastward to Maine and Florida with 22,000 cells. Each cell measures eighty kilometers square. Stacked up, the cells make fifteen vertical layers reaching about fifteen kilometers high. The airborne nutrient loads are transported by the Airshed Model and linked to the Watershed Model through deposition to land surfaces and to the Estuary Model through deposition to the water surfaces of the tidal Bay.
View map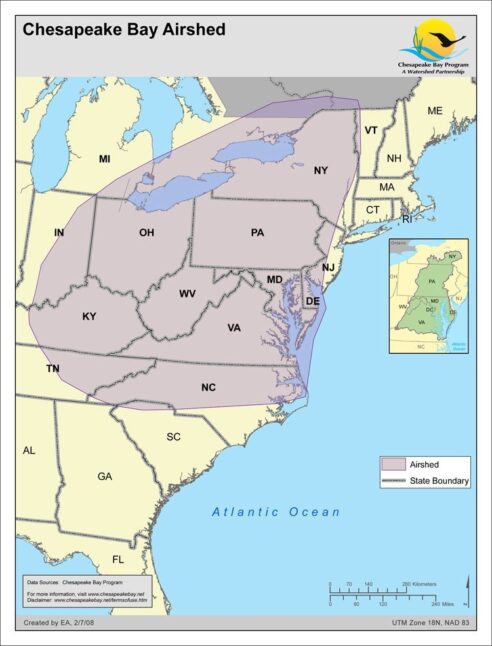
Impervious Surfaces
Date created: January 30, 2008Impervious surfaces, or surfaces that do not absorb water, compose roughly 17% of all urban and suburban lands in the Bay watershed. Impervious surfaces alter the natural flow of streams because they typically carry rainfall directly into streams via gutters and storm sewers, bypassing wetlands and riparian forest buffers, both of which filter and slow down the flow of water. Impervious surfaces are sometimes built near streams and rivers, replacing existing riparian buffers, which can in turn degrade those streams. Impervious surfaces also limit the filtration of rainwater into the soil, potentially reducing the amount of water reaching shallow streams and groundwater aquifers. Finally, impervious surfaces help to carry airborne pollutants to streams. In natural landscapes, some pollutants can be retained and broken down in the soil or plants that intercept water as it flows over the land and into streams.
View map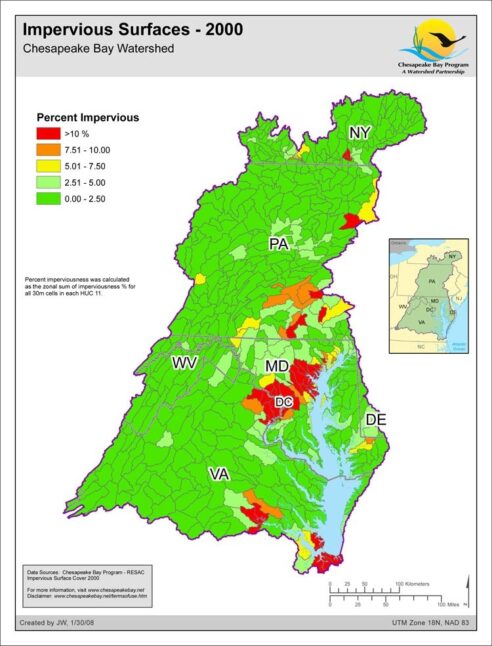
Chesapeake Bay 2003 Segmentation Scheme - Codes
Date created: January 27, 2008The 2003 Chesapeake Bay Program Segmentation Scheme is a revision of the 2000 version that incorporates four changes: the addition of a new segment (ANATF) that separates the Anacostia River from the rest of the Potomac Tidal Fresh (POTTF) segment, the merger of two Elizabeth River segments (ELIMH and ELIPH into ELIPH) and the small segment boundary location changes between Mattaponi River segments MPNTF and MPNOH and between Choptank River segments CHOTF and CHOOH. Further information about the 2003 Chesapeake Bay Program Segmentation Scheme can be found at http://www.chesapeakebay.net/segmentscheme.htm
View map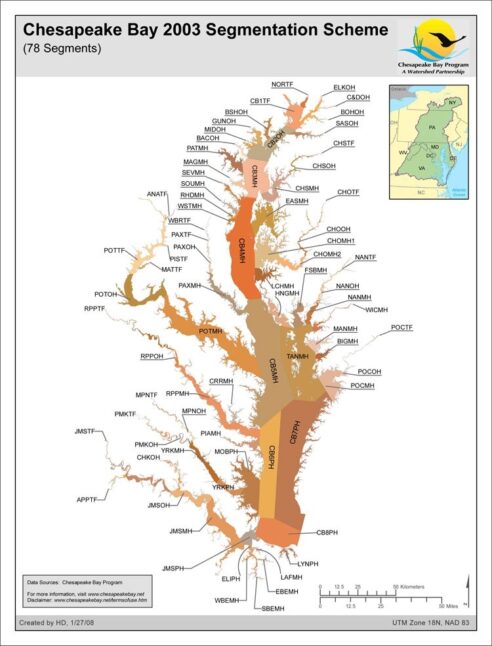
Water Quality Protection Value - Resource Lands Assessment
Date created: January 24, 2008The Water Quality model aims to identify forests and wetlands important in protecting water quality and sustaining watershed integrity. This "watershed value" is based on physical and biological functions that store precipitation, retain and assimilate nutrients, moderate runoff, protect soils and maintain important critical landscape functions such as those of riparian buffers.
View map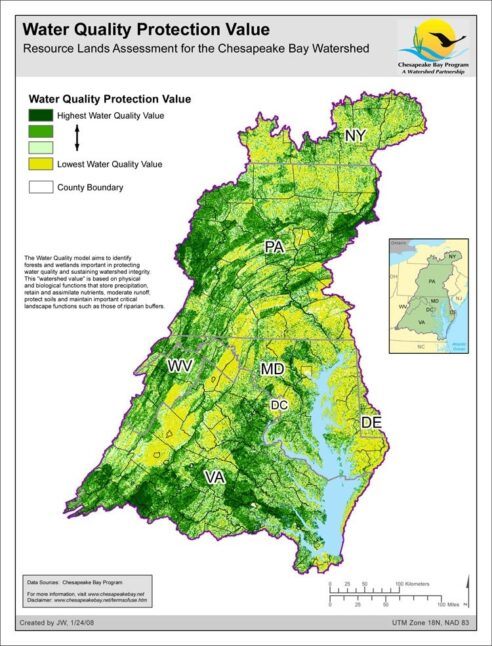
Vulnerability - Resource Lands Assessment
Date created: January 23, 2008The Resource Lands Assessment vulnerability layer evaluates the relative potential risk of future land conversion to urban uses. Vulnerability is defined as a function of suitability for development and proximity to growth "hot spots". The vulnerability layer is useful as a stand-alone layer to evaluate development trends, but can also be combined with the other RLA layers to prioritize land conservation efforts.
View map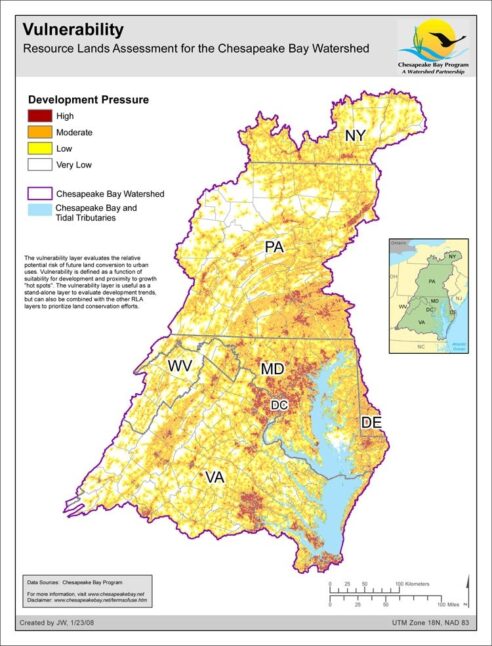
Land Cover: Chesapeake Bay Watershed
Date created: January 23, 2008The National Land Cover Database 2001 land cover layer for mapping zone 60 was produced through a cooperative project conducted by the Multi-Resolution Land Characteristics (MRLC) Consortium, a partnership of federal agencies (www.mrlc.gov), consisting of the U.S. Geological Survey (USGS), the National Oceanic and Atmospheric Administration (NOAA), the U.S. Environmental Protection Agency (EPA), the U.S. Department of Agriculture (USDA), the U.S. Forest Service (USFS), the National Park Service (NPS), the U.S. Fish and Wildlife Service (FWS), the Bureau of Land Management (BLM) and the USDA Natural Resources Conservation Service (NRCS). It is intended to serve as a consistent, seamless, and accurate National Land Cover Database circa 2001 for the US at medium spatial resolution. The NLCD 2001 is created by partitioning the U.S. into 66 mapping zones delineated within the conterminous U.S. based on ecoregion and geographical characteristics, edge matching features and the size requirement of Landsat mosaics. The Chesapeake Bay Watershed is derived from zone 60 which encompasses whole or portions of several states, including the states of New York, Delaware, Maryland, Pennsylvania, Virginia, and the District of Columbia. The Chesapeake Bay Program GIS Team modified this data to represent low/medium intensity development, high intensity development, wetlands, forest, agriculture, and barren land within the Chesapeake Bay Watershed.
View map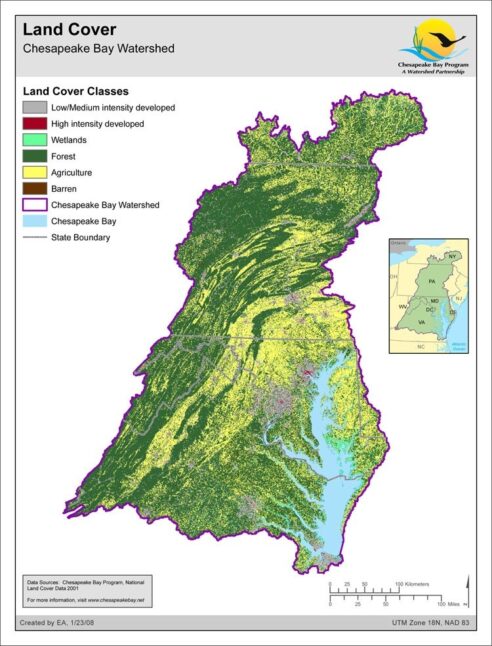
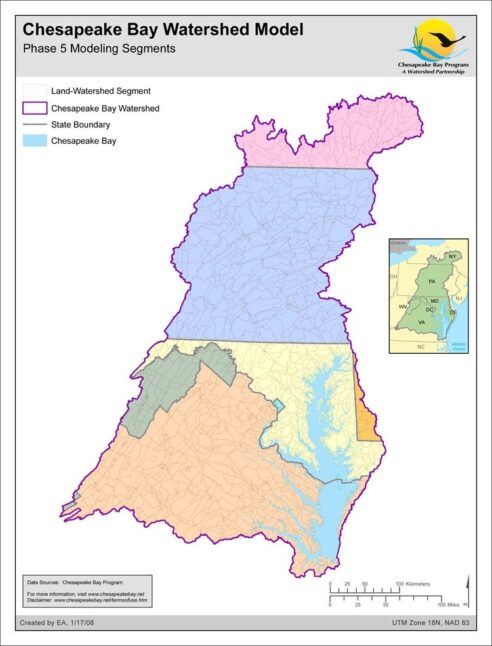
Phase 5.0 Model Segmentation, Chesapeake Bay Watershed Model
Date created: January 17, 2008In order to divide the model domain into county based land segments, a finer segmented river reach network and associated watersheds.This data set is an ArcGIS shapefile depicting land segments in the Chesapeake Bay Watershed and adjacent states of New York, Pennsylvania, Maryland, West Virginia, Delaware, Virginia as well as North Carolina and Tennessee (not shown). Land segmentation was based on county boundaries represented by a 1:100,000-scale digital dataset. Fifty of the 254 counties and incorporated cities in the model region were divided on the basis of physiography and topography, producing a total of 310 land segments. The data are projected to the UTM grid coordinate system - Zone 18 NAD83. Land and watersheds segments were intersected to create land-watershed segments for the model. The land segments are to be used with the Chesapeake Bay Regional Watershed Model to represent the county political boundaries and areas of differing physiography and topography in the study area.
View map