Maps
Browse through maps depicting Bay health and restoration, including pollution trends, public access sites and more.
Hydrologic Unit Boundaries - HUC 11
Date created: February 5, 2008The 11 digit Hydrologic Unit Code (HUC) coverage for the Chesapeake Bay watershed states level is an aggregate of the individual states clipped to the Chesapeake Bay Basin boundaries. These states are Delaware, Maryland, New York, Pennsylvania, Virginia, West Virginia, and Washington, D.C. This aggregate HUC-11 data set has been modified by the Chesapeake Bay Program GIS Team from USGS data to ensure edge matching and closed watersheds along state boundaries. There are a total of 506 HUC-11/watersheds for the Chesapeake Bay Basin in this aggregate data set.
View map
Hydrologic Unit Boundaries - HUC 8
Date created: February 5, 20088-digit Hydrologic Unit Code (HUC) for the Chesapeake Bay watershed states level was created by dissolving huc11_hr02.The aggregate HUC-11 data set has been modified from USGS data by the Chesapeake Bay Program GIS Team to ensure edge matching and closed watersheds along state boundaries. There are a total of 506 HUC-11/watersheds for the Chesapeake Bay Basin in this aggregate data set.
View map
Classification of Watersheds - Based on 2000 Land cover
Date created: February 1, 2008This map separates small watersheds of the Chesapeake Bay basin into eight classes based on the percentages of forest, agriculture and developed land covers from year 2000 satellite data within those watersheds. A similar map was published in the State of the Chesapeake Forests report.
View map
Cultural Assets - Resource Lands Assessment
Date created: February 1, 2008The basic premise of the cultural resources assessment was to identify the relative value and importance of lands with associated cultural resources in the Chesapeake Bay watershed. Lands were ranked relative to the importance of the cultural site, feature or area as expressed by state or federal designation. There were five categories of cultural sites, features or areas assessed in the model: National Historic Landmarks, National Historic Districts, National Historic Register Sites, state inventoried sites and archaeological sites. The model integrates the selected data sets, maps the coincident areas important for cultural resources and scores 3 square km grid cells based on a weighted ranking.
View map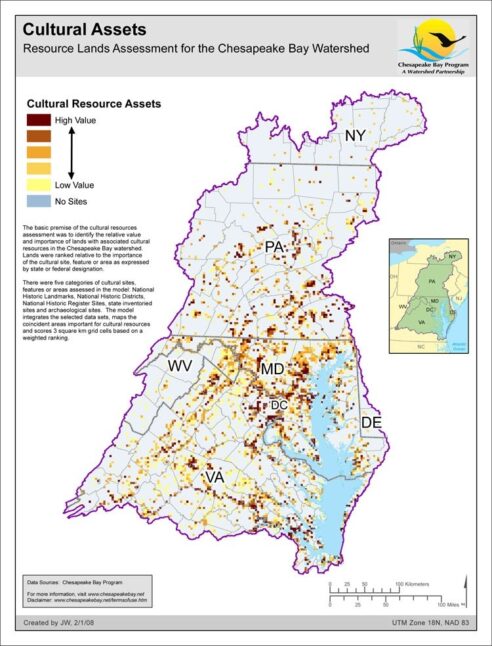
Plankton Monitoring Stations - In Use 2000-2007
Date created: January 31, 2008Phytoplankton monitoring is designed to detect and monitor changes in phytoplankton and picoplankton abundances and species composition in relation to changing water quality conditions in the Chesapeake Bay. These plankton are the dominant primary producers on the Bay and are the base of the food chain. Excessive blooms of phytoplankton species are considered evidence of eutrophication in the Bay and degrade water quality as well as block needed light to bay grasses.
View map
Benthic Monitoring Stations - 2006 Sampling
Date created: January 31, 2008Benthic organisms are animals, plants and bacteria that live on or at the bottom of water bodies. These benthos are an important part of the food web, as they consume phytoplankton and in turn are consumed by larger organisms, including finfish. Another service benthic organisms perform is to break down organic matter that collects on the bottom of the Bay. The Chesapeake Bay Program monitors the health of these benthic communities using both fixed and random stations. The results of this monitoring are compiled into an Index of Biotic Integrity (IBI).
View map
Priority Living Resource Areas
Date created: January 31, 2008The Chesapeake Bay Program's target species listed in Habitat Requirements for Chesapeake Bay Living Resources, Second Edition (1991) which had habitat requirements that could be directly affected by nutrient over enrichment (e.g., dissolved oxygen) or sediments (e.g., light penetration) were arrayed by water column and bottom as their principal habitats. These included all the fish and shellfish species in that document, with several fish species and related layers added for newer potential habitat information was available. Priority areas for Submerged Aquatic Vegetation (SAV) were considered separately. Priority Living Resource Areas were identified based on the co-occurrence of habitats for multiple water column and bottom species.
View map
Impervious Surfaces
Date created: January 30, 2008Impervious surfaces, or surfaces that do not absorb water, compose roughly 17% of all urban and suburban lands in the Bay watershed. Impervious surfaces alter the natural flow of streams because they typically carry rainfall directly into streams via gutters and storm sewers, bypassing wetlands and riparian forest buffers, both of which filter and slow down the flow of water. Impervious surfaces are sometimes built near streams and rivers, replacing existing riparian buffers, which can in turn degrade those streams. Impervious surfaces also limit the filtration of rainwater into the soil, potentially reducing the amount of water reaching shallow streams and groundwater aquifers. Finally, impervious surfaces help to carry airborne pollutants to streams. In natural landscapes, some pollutants can be retained and broken down in the soil or plants that intercept water as it flows over the land and into streams.
View map
Bay Grasses - Distribution Used to Set the Restoration Goal in 2003
Date created: January 29, 2008This map shows the historic distribution of bay grasses that was used in 2003 to set the Chesapeake Bay Program SAV (or bay grass) restoration goal of 184,899 acres. This goal is based on an aggregation of the maximum amount of SAV surveyed in a single year for each Bay Program monitoring segment. Bay grasses are a vital part of the Chesapeake Bay ecosystem. They provide habitat for crabs and juvenile fish and food for waterfowl. Bay grasses grow mostly in waters that are 2 meters in depth or less and are negatively affected by poor water clarity.
View map
Chesapeake Bay Watershed
Date created: January 29, 2008Outline of the Chesapeake Bay watershed with elevation relief.
View map