Maps
Browse through maps depicting Bay health and restoration, including pollution trends, public access sites and more.
Chesapeake Bay watershed 10 year phosphorus flow-adjusted concentration trend 2002 - 2011
Date created: January 2, 2013Over the past 10 years, the majority of phosphorus concentration trends are non-significant monitoring at sites within the Bay watershed with many sites showing improving condition and only a few are degrading. The trend results indicate that in many locations, management actions, such as improved wastewater treatment and nonpoint-source pollution controls (i.e. urban stormwater runoff and agricultural runoff controls), have reduced phosphorus concentrations in streams.
View map
Chesapeake Bay watershed 10 year nitrogen flow-adjusted concentration trend 2002 - 2011
Date created: January 2, 2013Over the past 10 years, the majority of nitrogen concentration trends are non-significant (28 sites), with 19 sites showing improving condition and only 1 site showing degrading conditions. The trend results indicate that in many locations, management actions, such as improved wastewater treatment and nonpoint-source pollution controls (i.e. urban stormwater runoff and agricultural runoff controls), have reduced nitrogen concentrations in streams.
View map
Chesapeake Bay watershed suspended sediment long-term flow-adjusted concentration trends 1985-2011
Date created: January 2, 2013Changes in suspended sediment concentrations have been determined for the period 1985-2011 at 31 stream sites in the Chesapeake Bay watershed. Of these, 14 sites show trends that were not statistically significant, 9 sites show improving trends, and 8 sites show degrading trends.
View map
Chesapeake Bay watershed phosphorus long-term flow-adjusted concentration trends 1985 - 2011
Date created: January 2, 2013Changes in phosphorus concentrations have been determined for the period 1985-2011 at 31 stream sites in the Chesapeake Bay watershed. Of these, the majority of the flow-adjusted trends were downward, with 22 sites showing decreasing trends, 4 sites showing increasing trends, and 5 sites showing trends that were not statistically significant.
View map
Chesapeake Bay watershed nitrogen long-term flow-adjusted concentration trends 1985 - 2011
Date created: January 2, 2013Changes in nitrogen concentrations have been determined for the period 1985-2011 at 31 stream sites in the Chesapeake Bay watershed. Of these, the majority of the flow-adjusted trends were improving, with 21 sites having improving trends, 3 sites had degrading trends, and 7 sites the trends were not statistically significant.
View map
Public Access Sites 2011
Date created: November 28, 2012Existing public access sites in the Chesapeake Bay watershed as depicted in the 2012 Chesapeake Bay Public Access Plan
View map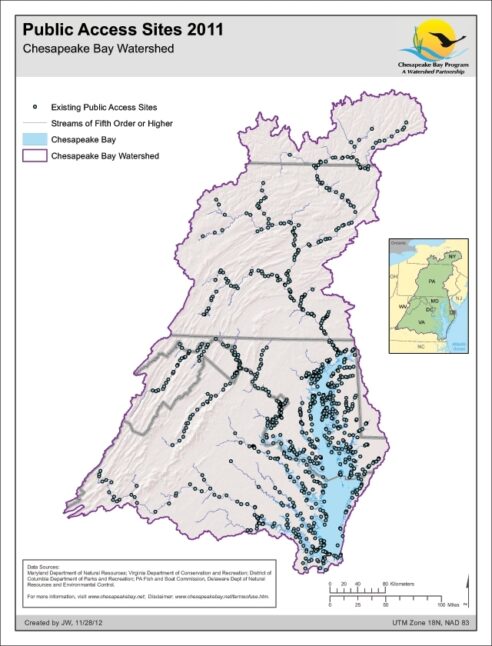
Protected Lands 2011
Date created: November 15, 2012This map represents a complete, aggregated layer of protected lands in the Chesapeake Bay Watershed and intersecting Counties as of 2011. It is a combination of multiple State, Federal and Non-Governmental Organization sources. Overlapping and duplicate areas have be deleted to address double counting.
View map
Long-Term Flow-Adjusted Trends for Sediment for 31 Sites in the Chesapeake Bay Watershed
Date created: June 28, 2012Long-Term Flow-Adjusted Concentration Trends for Suspended Sediment for 31 Sites in the Chesapeake Bay Watershed, 1985-2010
View map
Long-Term Flow-Adjusted Trends for Total Phosphorus for 31 Sites in the Chesapeake Bay Watershed
Date created: June 28, 2012Long-Term Flow-Adjusted Trends for Total Phosphorus for 31 Sites in the Chesapeake Bay Watershed, 1985-2010
View map
Long-Term Flow-Adjusted Trends for Total Nitrogen for 31 Sites in the Chesapeake Bay Watershed
Date created: June 28, 2012Long-Term Flow-Adjusted Trends for Total Nitrogen for 31 Sites in the Chesapeake Bay Watershed, 1985-2010
View map