Maps
Browse through maps depicting Bay health and restoration, including pollution trends, public access sites and more.
Point Sources and Priority Agricultural Watersheds - Delaware
Date created: July 15, 2011This map shows the location of point sources of nutrient pollution and priority agricultural watersheds as identified by the Chesapeake Bay Program with input from the Natural Resources Conservation Service (NRCS). Point sources include both monitored and estimated data submitted from or approved by each jurisdiction. Priority agricultural watersheds include SPARROW catchments ranking in the top quartile for delivered loads of nitrogen or phosphorus from agricultural sources normalized by the total amount of agricultural areas within the catchment. The priority areas were further refined to emphasize high loading areas which also contained potential agriculture-related water quality impairments based on individual state 303d (impaired waters) lists.
View mapPoint Sources and Priority Agricultural Watersheds - West Virginia
Date created: July 15, 2011This map shows the location of point sources of nutrient pollution and priority agricultural watersheds as identified by the Chesapeake Bay Program with input from the Natural Resources Conservation Service (NRCS). Point sources include both monitored and estimated data submitted from or approved by each jurisdiction. Priority agricultural watersheds include SPARROW catchments ranking in the top quartile for delivered loads of nitrogen or phosphorus from agricultural sources normalized by the total amount of agricultural areas within the catchment. The priority areas were further refined to emphasize high loading areas which also contained potential agriculture-related water quality impairments based on individual state 303d (impaired waters) lists.
View mapPoint Sources and Priority Agricultural Watersheds - New York
Date created: March 9, 2009This map shows the location of point sources of nutrient pollution and priority agricultural watersheds as identified by the Chesapeake Bay Program with input from the Natural Resources Conservation Service (NRCS). Point sources include both monitored and estimated data submitted from or approved by each jurisdiction. Priority agricultural watersheds include SPARROW catchments ranking in the top quartile for delivered loads of nitrogen or phosphorus from agricultural sources normalized by the total amount of agricultural areas within the catchment. The priority areas were further refined to emphasize high loading areas which also contained potential agriculture-related water quality impairments based on individual state 303d (impaired waters) lists.
View mapPoint Sources and Priority Agricultural Watersheds - Virginia
Date created: March 9, 2009This map shows the location of point sources of nutrient pollution and priority agricultural watersheds as identified by the Chesapeake Bay Program with input from the Natural Resources Conservation Service (NRCS). Point sources include both monitored and estimated data submitted from or approved by each jurisdiction. Priority agricultural watersheds include SPARROW catchments ranking in the top quartile for delivered loads of nitrogen or phosphorus from agricultural sources normalized by the total amount of agricultural areas within the catchment. The priority areas were further refined to emphasize high loading areas which also contained potential agriculture-related water quality impairments based on individual state 303d (impaired waters) lists.
View mapPoint Sources and Priority Agricultural Watersheds - Pennsylvania
Date created: March 9, 2009This map shows the location of point sources of nutrient pollution and priority agricultural watersheds as identified by the Chesapeake Bay Program with input from the Natural Resources Conservation Service (NRCS). Point sources include both monitored and estimated data submitted from or approved by each jurisdiction. Priority agricultural watersheds include SPARROW catchments ranking in the top quartile for delivered loads of nitrogen or phosphorus from agricultural sources normalized by the total amount of agricultural areas within the catchment. The priority areas were further refined to emphasize high loading areas which also contained potential agriculture-related water quality impairments based on individual state 303d (impaired waters) lists.
View mapPoint Sources and Priority Agriculture Watersheds - Chesapeake Bay Watershed
Date created: March 9, 2009This map shows the location of point sources of nutrient pollution and priority agricultural watersheds as identified by the Chesapeake Bay Program with input from the Natural Resources Conservation Service (NRCS). Point sources include both monitored and estimated data submitted from or approved by each jurisdiction. Priority agricultural watersheds include SPARROW catchments ranking in the top quartile for delivered loads of nitrogen or phosphorus from agricultural sources normalized by the total amount of agricultural areas within the catchment. The priority areas were further refined to emphasize high loading areas which also contained potential agriculture-related water quality impairments based on individual state 303d (impaired waters) lists.
View mapPoint Sources and Priority Agricultural Watersheds - Maryland
Date created: March 9, 2009This map shows the location of point sources of nutrient pollution and priority agricultural watersheds as identified by the Chesapeake Bay Program with input from the Natural Resources Conservation Service (NRCS). Point sources include both monitored and estimated data submitted from or approved by each jurisdiction. Priority agricultural watersheds include SPARROW catchments ranking in the top quartile for delivered loads of nitrogen or phosphorus from agricultural sources normalized by the total amount of agricultural areas within the catchment. The priority areas were further refined to emphasize high loading areas which also contained potential agriculture-related water quality impairments based on individual state 303d (impaired waters) lists.
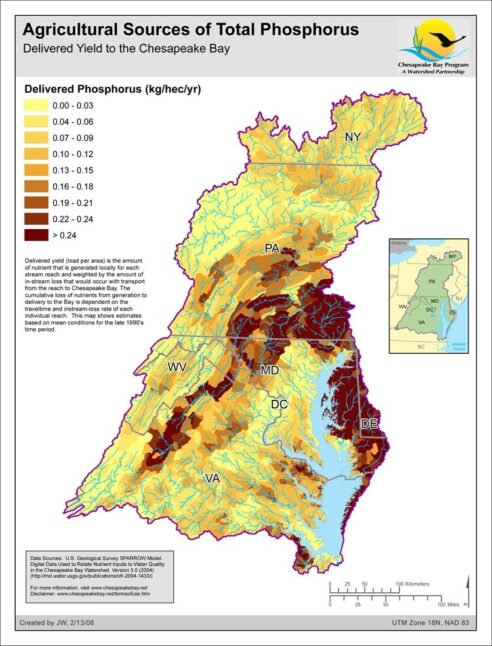
View mapDelivered Yield of Total Phosphorus - Agricultural Sources
Date created: February 13, 2008This map shows the Delivered yield (load per area) of Total Phosphorus from agricultural sources. Delivered yield is the amount of nutrient that is generated locally for each stream reach and weighted by the amount of in-stream loss that would occur with transport from the reach to Chesapeake Bay. The cumulative loss of nutrients from generation to delivery to the Bay is dependent on the travel time and instream-loss rate of each individual reach. This map shows estimates of Total Nitrogen based on mean conditions for the late 1990's time period using the SPARROW model from USGS. SPARROW, or SPAtially Referenced Regressions On Watershed (SPARROW) attributes, uses a nonlinear regression approach to spatially relate nutrient sources and watershed characteristics to nutrient loads of streams throughout the Chesapeake Bay watershed.
View map
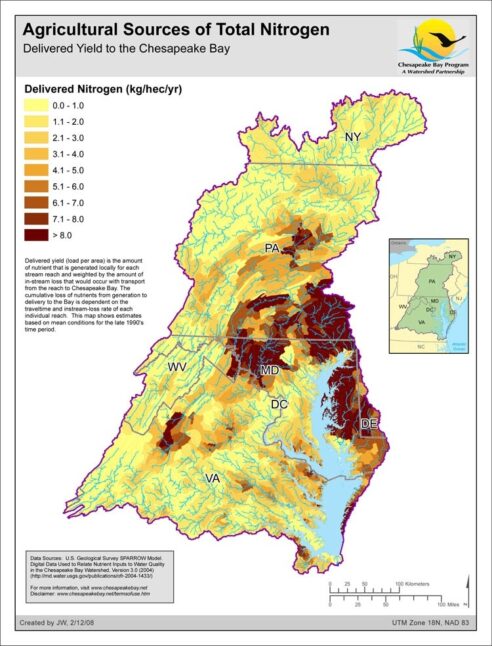
Delivered Yield of Total Nitrogen - Agricultural Sources
Date created: February 12, 2008This map shows the Delivered yield (load per area) of Total Nitrogen from agricultural sources. Delivered yield is the amount of nutrient that is generated locally for each stream reach and weighted by the amount of in-stream loss that would occur with transport from the reach to Chesapeake Bay. The cumulative loss of nutrients from generation to delivery to the Bay is dependent on the travel time and instream-loss rate of each individual reach. This map shows estimates of Total Nitrogen based on mean conditions for the late 1990's time period using the SPARROW model from USGS. SPARROW, or SPAtially Referenced Regressions On Watershed (SPARROW) attributes, uses a nonlinear regression approach to spatially relate nutrient sources and watershed characteristics to nutrient loads of streams throughout the Chesapeake Bay watershed.
View map
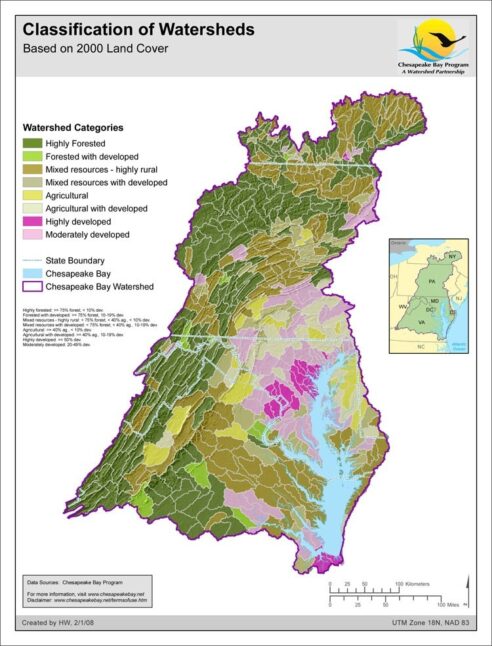
Classification of Watersheds - Based on 2000 Land cover
Date created: February 1, 2008This map separates small watersheds of the Chesapeake Bay basin into eight classes based on the percentages of forest, agriculture and developed land covers from year 2000 satellite data within those watersheds. A similar map was published in the State of the Chesapeake Forests report.
View map
