Maps
Browse through maps depicting Bay health and restoration, including pollution trends, public access sites and more.
Delivered Yield of Total Nitrogen - Urban Sources
Date created: February 13, 2008This map shows the Delivered yield (load per area) of Total Nitrogen from urban sources. Delivered yield is the amount of nutrient that is generated locally for each stream reach and weighted by the amount of in-stream loss that would occur with transport from the reach to Chesapeake Bay. The cumulative loss of nutrients from generation to delivery to the Bay is dependent on the travel time and instream-loss rate of each individual reach. This map shows estimates of Total Nitrogen based on mean conditions for the late 1990's time period using the SPARROW model from USGS. SPARROW, or SPAtially Referenced Regressions On Watershed (SPARROW) attributes, uses a nonlinear regression approach to spatially relate nutrient sources and watershed characteristics to nutrient loads of streams throughout the Chesapeake Bay watershed.
View map
Delivered Yield of Total Nitrogen - Point Sources
Date created: February 13, 2008This map shows the Delivered yield (load per area) of Total Nitrogen from point sources. Delivered yield is the amount of nutrient that is generated locally for each stream reach and weighted by the amount of in-stream loss that would occur with transport from the reach to Chesapeake Bay. The cumulative loss of nutrients from generation to delivery to the Bay is dependent on the travel time and instream-loss rate of each individual reach. This map shows estimates of Total Nitrogen based on mean conditions for the late 1990's time period using the SPARROW model from USGS. SPARROW, or SPAtially Referenced Regressions On Watershed (SPARROW) attributes, uses a nonlinear regression approach to spatially relate nutrient sources and watershed characteristics to nutrient loads of streams throughout the Chesapeake Bay watershed.
View map
Delivered Yield of Total Nitrogen - All Sources
Date created: February 13, 2008This map shows the Delivered yield (load per area) of Total Nitrogen from all sources. Delivered yield is the amount of nutrient that is generated locally for each stream reach and weighted by the amount of in-stream loss that would occur with transport from the reach to Chesapeake Bay. The cumulative loss of nutrients from generation to delivery to the Bay is dependent on the travel time and instream-loss rate of each individual reach. This map shows estimates of Total Nitrogen based on mean conditions for the late 1990's time period using the SPARROW model from USGS. SPARROW, or SPAtially Referenced Regressions On Watershed (SPARROW) attributes, uses a nonlinear regression approach to spatially relate nutrient sources and watershed characteristics to nutrient loads of streams throughout the Chesapeake Bay watershed.
View map
Delivered Yield of Total Nitrogen - Agricultural Sources
Date created: February 12, 2008This map shows the Delivered yield (load per area) of Total Nitrogen from agricultural sources. Delivered yield is the amount of nutrient that is generated locally for each stream reach and weighted by the amount of in-stream loss that would occur with transport from the reach to Chesapeake Bay. The cumulative loss of nutrients from generation to delivery to the Bay is dependent on the travel time and instream-loss rate of each individual reach. This map shows estimates of Total Nitrogen based on mean conditions for the late 1990's time period using the SPARROW model from USGS. SPARROW, or SPAtially Referenced Regressions On Watershed (SPARROW) attributes, uses a nonlinear regression approach to spatially relate nutrient sources and watershed characteristics to nutrient loads of streams throughout the Chesapeake Bay watershed.
View map
Omernik Ecoregions
Date created: February 12, 2008The ecoregions shown in this map have been derived from Omernik (1987) and from subsequent refinements of Omernik's framework. Designed to serve as a spatial framework for environmental resource management, ecoregions denote areas within which ecosystems (and the type, quality, and quantity of environmental resources) are generally similar. The approach used to compile this map is based on the premise that ecological regions can be identified through the analysis of the patterns and the composition of biotic and abiotic phenomena that affect or reflect differences in ecosystem quality and integrity (Wiken 1986; Omernik 1987, 1995). These phenomena include geology, physiography, vegetation, climate, soils, land use, wildlife, and hydrology. Omernik, J.M. 1987. Ecoregions of the conterminous United States. Map (scale 1:7,500,000). Annals of the Association of American Geographers 77(1):118-125. Omernik, J.M. 1995. Ecoregions: A spatial framework for environmental management. In: Biological Assessment and Criteria: Tools for Water Resource Planning and Decision Making. Davis, W.S. and T.P. Simon (eds.) Lewis Publishers, Boca Raton, FL. Pp. 49-62. Wiken, E. 1986. Terrestrial ecozones of Canada. Environment Canada. Ecological Land Classification Series No. 19. Ottawa, Canada.
View map
Hydrogeomorphic Regions
Date created: February 11, 2008Generalized lithology (rock type) and physiography based on geologic formations were used to characterize hydrgeomorphic regions (HGMR) within the Chesapeake Bay watershed. These HGMRs were used in conjunction with existing data to assess the significance of ground-water discharge as a source of nitrate load to non-tidal streams in the Chesapeake Bay watershed (Bachman and others, 1998). This work is part of the U.S. Geological Survey's (USGS) Chesapeake Bay initiative to develop an understanding and provide scientific information for the restoration of the Chesapeake Bay and its watershed. Bachman J., B. Lindsey, J. Brakebill, and D. Powars. 1998. Ground-Water Discharge and Base-Flow Nitrate Loads of Nontidal Streams, and Their Relation to a Hydrogeomorphic Classification of the Chesapeake Bay Watershed, Middle Atlantic Coast.
View map
Migratory Fish Spawning & Nursery Designated Use
Date created: February 7, 2008Chesapeake Bay tidal waters support spawning areas and juvenile nurseries for a host of anadromous and semi-anadromous fish, such as striped bass and shad. These fish are important not only to Chesapeake Bay fishery populations, but also to those of the entire East Coast. The eggs, larvae and early juveniles of anadromous and semi-anadromous species often have more sensitive habitat quality requirements than other species and life stages. Waters with the Migratory Fish Spawning & Nursery designated use support the survival, growth and propagation of balanced indigenous populations of ecologically, recreationally and commercially important anadromous, semi-anadromous and tidal-fresh resident fish species inhabiting spawning and nursery grounds from February 1 through May 31.
View map
Chesapeake Bay Watershed Physiography
Date created: February 6, 2008Physiographic provinces in the Chesapeake Bay Watershed. Physiographic data derived from USGS and modified by the Chesapeake Bay Program GIS Team to divide the Piedmont into three distinct regions. Two out of the eight major US physiographic regions fall within the Chesapeake Bay Watershed; the Atlantic Plains and Appalachian Highlands. Within these regions, there are eight provinces within the Bay Watershed; the Appalachian Plateau, Appalachian Mountain, Blue Ridge, Great Valley, Mezosoic Lowland, Piedmont Upland, Piedmont Lowland, and Coastal Plains. Physiographic provinces are categorized by rock type, terrain texture, as well as geologic structure and history.
View map
Classification of Watersheds - Based on 2000 Land cover
Date created: February 1, 2008This map separates small watersheds of the Chesapeake Bay basin into eight classes based on the percentages of forest, agriculture and developed land covers from year 2000 satellite data within those watersheds. A similar map was published in the State of the Chesapeake Forests report.
View map
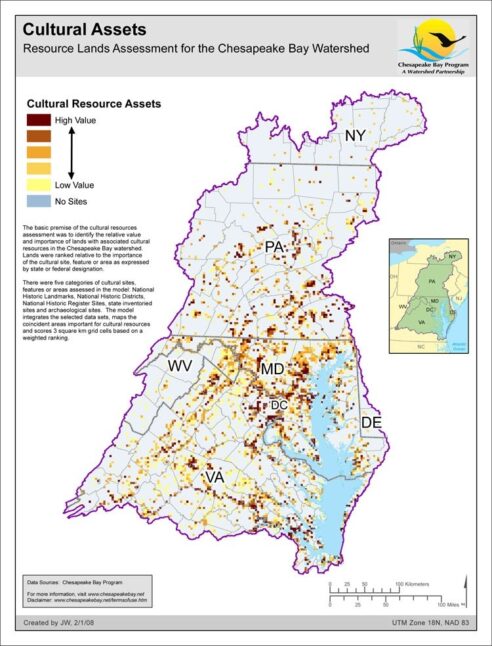
Cultural Assets - Resource Lands Assessment
Date created: February 1, 2008The basic premise of the cultural resources assessment was to identify the relative value and importance of lands with associated cultural resources in the Chesapeake Bay watershed. Lands were ranked relative to the importance of the cultural site, feature or area as expressed by state or federal designation. There were five categories of cultural sites, features or areas assessed in the model: National Historic Landmarks, National Historic Districts, National Historic Register Sites, state inventoried sites and archaeological sites. The model integrates the selected data sets, maps the coincident areas important for cultural resources and scores 3 square km grid cells based on a weighted ranking.
View map