Maps
Browse through maps depicting Bay health and restoration, including pollution trends, public access sites and more.
Plankton Monitoring Stations - In Use 2000-2007
Date created: January 31, 2008Phytoplankton monitoring is designed to detect and monitor changes in phytoplankton and picoplankton abundances and species composition in relation to changing water quality conditions in the Chesapeake Bay. These plankton are the dominant primary producers on the Bay and are the base of the food chain. Excessive blooms of phytoplankton species are considered evidence of eutrophication in the Bay and degrade water quality as well as block needed light to bay grasses.
View map
Benthic Monitoring Stations - 2006 Sampling
Date created: January 31, 2008Benthic organisms are animals, plants and bacteria that live on or at the bottom of water bodies. These benthos are an important part of the food web, as they consume phytoplankton and in turn are consumed by larger organisms, including finfish. Another service benthic organisms perform is to break down organic matter that collects on the bottom of the Bay. The Chesapeake Bay Program monitors the health of these benthic communities using both fixed and random stations. The results of this monitoring are compiled into an Index of Biotic Integrity (IBI).
View map
Priority Living Resource Areas
Date created: January 31, 2008The Chesapeake Bay Program's target species listed in Habitat Requirements for Chesapeake Bay Living Resources, Second Edition (1991) which had habitat requirements that could be directly affected by nutrient over enrichment (e.g., dissolved oxygen) or sediments (e.g., light penetration) were arrayed by water column and bottom as their principal habitats. These included all the fish and shellfish species in that document, with several fish species and related layers added for newer potential habitat information was available. Priority areas for Submerged Aquatic Vegetation (SAV) were considered separately. Priority Living Resource Areas were identified based on the co-occurrence of habitats for multiple water column and bottom species.
View map
Chesapeake Bay 2003 Segmentation Scheme - Codes
Date created: January 27, 2008The 2003 Chesapeake Bay Program Segmentation Scheme is a revision of the 2000 version that incorporates four changes: the addition of a new segment (ANATF) that separates the Anacostia River from the rest of the Potomac Tidal Fresh (POTTF) segment, the merger of two Elizabeth River segments (ELIMH and ELIPH into ELIPH) and the small segment boundary location changes between Mattaponi River segments MPNTF and MPNOH and between Choptank River segments CHOTF and CHOOH. Further information about the 2003 Chesapeake Bay Program Segmentation Scheme can be found at http://www.chesapeakebay.net/segmentscheme.htm
View map
Prime Farmland - Resource Lands Assessment
Date created: January 24, 2008Assessing the extent of farming on prime soils in the Bay watershed is a useful measure for determining the lands of highest importance for agricultural productivity and sustainability. This map shows the acres of potential prime soils that are actively farmed per square mile grid cell.
View map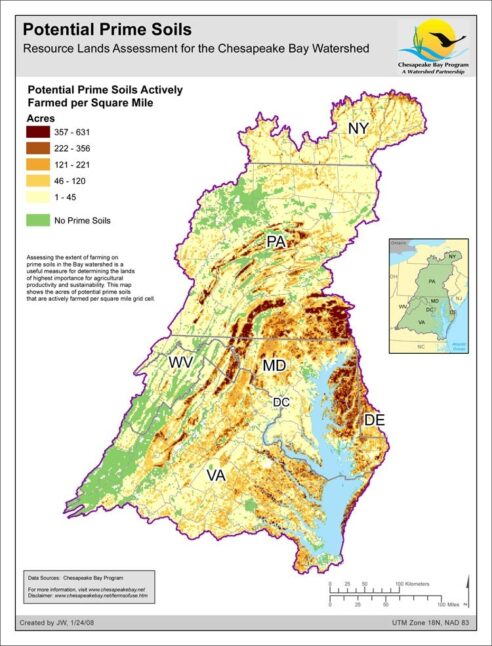
Water Quality Protection Value - Resource Lands Assessment
Date created: January 24, 2008The Water Quality model aims to identify forests and wetlands important in protecting water quality and sustaining watershed integrity. This "watershed value" is based on physical and biological functions that store precipitation, retain and assimilate nutrients, moderate runoff, protect soils and maintain important critical landscape functions such as those of riparian buffers.
View map
Vulnerability - Resource Lands Assessment
Date created: January 23, 2008The Resource Lands Assessment vulnerability layer evaluates the relative potential risk of future land conversion to urban uses. Vulnerability is defined as a function of suitability for development and proximity to growth "hot spots". The vulnerability layer is useful as a stand-alone layer to evaluate development trends, but can also be combined with the other RLA layers to prioritize land conservation efforts.
View map
Ecological Network - Resource Lands Assessment
Date created: January 23, 2008The Ecological Network Assessment aims to identify the most important remaining habitats in the Virginia, Maryland, Pennsylvania, West Virginia, Delaware, and D.C. portions of the Bay Watershed. The assessment applies a "hubs and corridors" approach, which is based on principles of landscape ecology and conservation biology, that suggest that size and connectivity are critical factors of high integrity habitat.
View map
Land Cover: Chesapeake Bay Watershed
Date created: January 23, 2008The National Land Cover Database 2001 land cover layer for mapping zone 60 was produced through a cooperative project conducted by the Multi-Resolution Land Characteristics (MRLC) Consortium, a partnership of federal agencies (www.mrlc.gov), consisting of the U.S. Geological Survey (USGS), the National Oceanic and Atmospheric Administration (NOAA), the U.S. Environmental Protection Agency (EPA), the U.S. Department of Agriculture (USDA), the U.S. Forest Service (USFS), the National Park Service (NPS), the U.S. Fish and Wildlife Service (FWS), the Bureau of Land Management (BLM) and the USDA Natural Resources Conservation Service (NRCS). It is intended to serve as a consistent, seamless, and accurate National Land Cover Database circa 2001 for the US at medium spatial resolution. The NLCD 2001 is created by partitioning the U.S. into 66 mapping zones delineated within the conterminous U.S. based on ecoregion and geographical characteristics, edge matching features and the size requirement of Landsat mosaics. The Chesapeake Bay Watershed is derived from zone 60 which encompasses whole or portions of several states, including the states of New York, Delaware, Maryland, Pennsylvania, Virginia, and the District of Columbia. The Chesapeake Bay Program GIS Team modified this data to represent low/medium intensity development, high intensity development, wetlands, forest, agriculture, and barren land within the Chesapeake Bay Watershed.
View map
Forest Economics - Resource Lands Assessment
Date created: January 23, 2008The identification of economically important forest lands focuses on the potential for future economic benefits associated with timber management activities. This considers not only the potential economic gain from forest harvest operations, but also the long-term economic sustainability of forest management and the local importance of the timber and wood products industry.
View map